I had a problem when I created document/folder name in Alfresco Share that included Polish characters, e.g., ą, ę, ł, ż, ź. The Polish characters at first were rendered correctly but in the database (MySQL) they were saved wrong, which means that ? character was put instead of Polish letters. To make it more confusing the names were rendered wrong not necessary straight away but for example after server restart. Such behaviour implies that there had to be a communication issue between Alfresco and database and the data were saved using wrong encoding in the database. Alfresco application had file names saved in cache so it did not use the database to obtain their names. When server was restarted the data were read from the database and ? were shown. Unfortunately having ? characters caused problems to read for example folder content.
The solution to this issue was to change default encoding in the database to UTF-8. In MySQL it can be done in configuration file (/etc/mysql/my.cnf on Ubuntu). The following lines should be added to the appropriate sections in configuration file.
Update on 2012.09.20: updated for Solr 4.0-BETA (from ALPHA, thanks for the comment Dorthe).
Update on 2013.07.09: updated for Solr 4.3.1
Update on 2013.07.28: the guide works with Solr 4.4, Ubuntu server 13.04 and tomcat7, just replace tomcat6 with tomcat7 and /var/lib/tomcat6/shared with /var/lib/tomcat7/lib
This short guide will describe how to install solr 4 on Ubuntu server. The versions I’m using are: Ubuntu Server 12.04 and Apache Solr 4.3.1. I will also show how to test the installation & perform a sample indexing and query.
Installation on tomcat Ubuntu 12.04 LTS
1. Install packages
apt-get install tomcat6 curl
2. Download solr 4 from http://lucene.apache.org/solr (at the time of writing it was solr-4.3.1.tgz)
3. Choose directory for solr – know as SOLR_HOME. I’ve chosen to put it into /opt/solr so my SOLR_HOME=/opt/solr. Replace /opt/solr with your own location if you want a different one.
4. Extract downloaded files anywhere and copy following to your $SOLR_HOME and to your tomcat installation:
copy example/solr/* to /opt/solr
copy example/webapps/solr.war to /opt/solr
copy example/lib/ext/* to /var/lib/tomcat6/shared
5. Edit dataDir in solr configuration file /opt/solr/collection1/conf/solrconfig.xml:
solr installation files come with sample schema.xml (we’ve already copied it into our $SOLR_HOME) and some .xml files with sample data we can import. We will use one of them to test if UTF-8 encoding is working as expected.
1. Go to the directory with extracted solr installation files and import utf8-example.xml using curl
This post describes how to debug JavaScript in Alfresco/Share.
There are two types of js files used in Alfresco/Share:
client side – they are placed in Share root directory
server side – they are placed in the path within WEB-INF/alfresco directory in Share and Alfresco and are used for example for by web scripts
Client side
Share Debugger
To debug JavaScript on client side client-debug and client-debug-autologging flags in Share configuration file share/WEB-INF/classes/alfresco/share-config.xml can be set to true as presented below. That allows to use JavaScript debugger after pressing (Ctrl, Ctrl, Shift, Shift). Setting client-debug to true causes using original *.js files instead of their minimised versions *-min.js. Setting client-debug-autologging to true enables the JavaScript debugger console.
Apart from that standard tools provided by web browsers can be used. They are really great and include:
Web Console (Tools -> Web Developer) in Firefox
Developer Tools (Tools) in Chrome
Server side
Log file
It is not so straight forward to debug server side script in Alfresco. Therefore there is logging class that saves the logging messages from JavaScript to standard log files/output. To see those change logging level for org.alfresco.repo.jscript.ScriptLogger class to DEBUG. Corresponding line of WEB-INF/classes/log4j.properties file is presented below:
Normally authentication is handled by Symfony nearly automatically – you just need to define and configure your firewalls. Sometimes, however you may want to perform authentication manually from the controller.
Imagine implementing automated login for a user upon visiting a URL like: /autologin/{secret}. I am not considering here the security of such a solution – you are discourage to do it this way, unless the information available for this kind of “logins” is not confidential.
The actual authentication is very straight-forward. Since I’m redirecting at the end of request, I don’t even need the user to be authenticated in this action. All that is needed is to persist the information about authenticated user to the session. This means storing serialized class that implements TokenInterface. Normally this is done by Symfony framework in ContextListener. In my scenario I’m using form login that uses UsernamePasswordToken, so in short here is what I need to do:
Find user
Create the Token
Store Token in the session
Pay attention to “secured_area” string – it matches the firewall name from the security.yml and is used to create the token and when creating a session key.
The purpose of this post is to present creation of new workflow that would copy attached file to selected location depending whether the document was approved or rejected. In addition, I explain in more detail wokflow console and show how to gather more information regarding workflows from it.
Creation of workflow and gathering information from workflow console
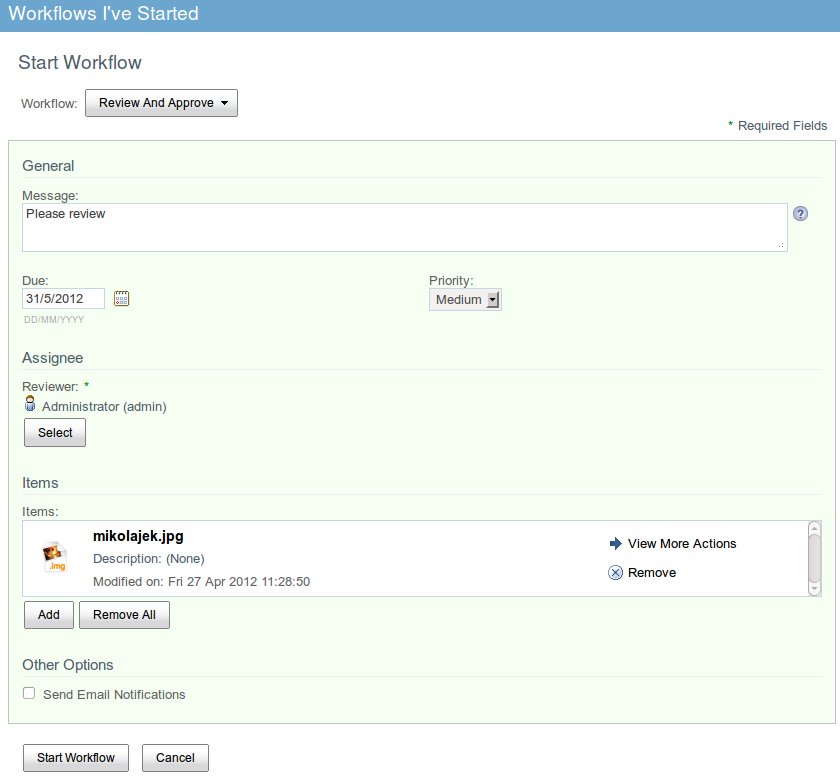
Let’s create simple workflow ‘Review and Approve’. The workflow has one document attached. The screen shot with initial worflow settings is presented below.
Run workflow console by running URL presented below. In this post all the URLs start with ‘http://localhost:8080/alfresco’ where it is path to your Alfresco deployment.
The relevant information about the node are presented below. As we can see the reference node is container for all the documents attached to the workflow. In our case it contains the file ‘mikolajek.jpg’ attached on workflow creation. This information is going to be useful when we have to find nodes to be copied.
Children

Child Name	        Child Node	                                                Primary	Association Type	                                Index
mikolajek.jpg	        workspace://SpacesStore/5351a554-3913-433f-8919-022d6dead7ce	false	{http://www.alfresco.org/model/bpm/1.0}packageContains	-1
Creation of new workflow
This section describes how to create new workflow that depending on whether task was approved or rejected is going to add appropriate aspect to all the files attached to the workflow. Let’s call the aspect ‘workflowOutcomeAspect’ and allow it to have two values: ‘approved’ or ‘rejected’. The definition of new aspect is presented below.
Following that let’s modify the initial workflow (‘Review and Approve’) to add ‘workflowOutcomeAspect’ to all the child nodes of package node and set property ‘workflowOutcome’ of that aspect to ‘approved’ or ‘rejected’ depending on user action. To note, ‘Review and Approve’ workflow is one of the standard workflows available with Alfresco deployment. The package is available in JavaScript under ‘bpm_package’ variable and its children can be obtained by invocation of ‘bpm_package.children’. More information about creation and management of workflows can be found in my post Creation of workflow in Alfresco using Activiti step by step.
On workflow approval or rejection the aspect variable ‘workflowOutcome’ will be set to appropriate value. In Alfresco Explorer or Share let’s create the rule that would check whether some documents in particular folder have ‘workflowOutcome’ set and depending on its value copy the documents to selected folder. Select ‘copy’ action as a rule. The rule summary is presented below. In fact, I have created two rules – one to copy approved documents and one to copy rejected ones.
Rule summary

Rule Type:	update
Name:	Approved documents
Description:
Apply rule to sub spaces:	No
Run rule in background:	Yes
Disable rule:	No
Conditions:	Text Property 'wf:workflowOutcome' Equals To 'approved'
Actions:	Move to 'approved'

Rule Type:	update
Name:	Rejected documents
Description:
Apply rule to sub spaces:	No
Run rule in background:	Yes
Disable rule:	No
Conditions:	Text Property 'wf:workflowOutcome' Equals To 'rejected'
Actions:	Move to 'rejected'
I hope that you have enjoyed the post and find it useful
This article describes few useful bits and pieces about running Apache Tomcat.
Setup of Tomcat environment variables – setenv.sh
As stated in CATALINA_BASE/bin/catalina.sh file the following environment variables can be set in CATALINA_BASE/bin/setenv.sh . setenv.sh script is run on Tomcat startup. It is not present in standard Tomcat distribution, so has to be created.
CATALINA_HOME May point at your Catalina “build” directory.
CATALINA_BASE (Optional) Base directory for resolving dynamic portions of a Catalina installation. If not present, resolves to the same directory that CATALINA_HOME points to.
CATALINA_OUT (Optional) Full path to a file where stdout and stderr will be redirected. Default is $CATALINA_BASE/logs/catalina.out
CATALINA_OPTS (Optional) Java runtime options used when the “start”, “run” or “debug” command is executed. Include here and not in JAVA_OPTS all options, that should only be used by Tomcat itself, not by the stop process, the version command etc. Examples are heap size, GC logging, JMX ports etc.
CATALINA_TMPDIR (Optional) Directory path location of temporary directory the JVM should use (java.io.tmpdir). Defaults to $CATALINA_BASE/temp.
JAVA_HOME Must point at your Java Development Kit installation. Required to run the with the “debug” argument.
JRE_HOME Must point at your Java Runtime installation.Defaults to JAVA_HOME if empty. If JRE_HOME and JAVA_HOME are both set, JRE_HOME is used.
JAVA_OPTS (Optional) Java runtime options used when any command is executed.Include here and not in CATALINA_OPTS all options, that should be used by Tomcat and also by the stop process, the version command etc. Most options should go into CATALINA_OPTS.
JAVA_ENDORSED_DIRS (Optional) Lists of of colon separated directories containing some jars in order to allow replacement of APIs created outside of the JCP (i.e. DOM and SAX from W3C). It can also be used to update the XML parser implementation. Defaults to $CATALINA_HOME/endorsed.
JPDA_TRANSPORT (Optional) JPDA transport used when the “jpda start” command is executed. The default is “dt_socket”.
JPDA_ADDRESS (Optional) Java runtime options used when the “jpda start” command is executed. The default is 8000.
JPDA_SUSPEND (Optional) Java runtime options used when the “jpda start” command is executed. Specifies whether JVM should suspend execution immediately after startup. Default is “n”.
JPDA_OPTS (Optional) Java runtime options used when the “jpda start” command is executed. If used, JPDA_TRANSPORT, JPDA_ADDRESS, and JPDA_SUSPEND are ignored. Thus, all required jpda options MUST be specified. The default is:
To run Tomcat you can use catalina.sh script with different options:
start: The Tomcat process is started in its own shell/session. Instead of that command you can run: startup.sh
run: The Tomcat process is started in current shell/session, the startup process output will be printed on the console, and the execution will be stopped on session close or on ctrl+c.
To test a performance of multiple parallel file downloads, I had to make sure that a download takes significant amount of time. I could use huge files but that’s not very helpful if you work on a local, 1Gb LAN. So I’ve decided to limit download speeds from my Apache server to my PC. Here we go.
1. Mark packages to be throttled, in my case those originating from port 80
$ iptables -A OUTPUT -p tcp --sport 80 -j MARK --set-mark 100
2. Use tc utility to limit traffic for the packages marked as above (handle 100):
$ tc qdisc add dev eth0 root handle 1:0 htb default 10
$ tc class add dev eth0 parent 1:0 classid 1:10 htb rate 1024kbps ceil 2048kbps prio 0
$ tc filter add dev eth0 parent 1:0 prio 0 protocol ip handle 100 fw flowid 1:10
3. That’s it, you can monitor/check your rules with:
$ tc filter show dev eth0
$ tc -s-d class show dev eth0
and finally remove the throttling with:
$ tc qdisc del dev eth0 root
$ iptables -D OUTPUT -p tcp --sport 80 -j MARK --set-mark 100
Some time ago I had to porcess a lot of images in a simple way – remove the top and bottom part of them. It was not a task I could automate – the amount of image I had to cut from the top & bottom varied for each photo. To make the mundane work a bit easier, I’ve created a script – python plugin.
The script assumes you have put two guide lines onto the image. It finds them, cuts the image from between them and saves as a new file.
To create such a simple script in python you need to:
import gimpfu
run register method that tells gimp (among other things), a function name that implements the script (special_crop) and where to put a link to the script in gimp menu (<Image>/Filters)
implement your function
copy script to your custom scripts folder (e.g. /home/…/.gimp-2.6/plug-ins)
The other locations you could use when choosing where in menu system a script should appear are:
“<Toolbox>”, “<Image>”, “<Layers>”, “<Channels>”, “<Vectors>”, “<Colormap>”, “<Load>”, “<Save>”, “<Brushes>”, “<Gradients>”, “<Palettes>”, “<Patterns>” or “<Buffers>”
And finally, the script itself. It’s fairly self-explanatory – enjoy and happy gimping!
#!/usr/bin/env python
fromgimpfuimport*defspecial_crop(image):print"Start"pdb=gimp.pdbtop=pdb.gimp_image_find_next_guide(image,0)top_y=pdb.gimp_image_get_guide_position(image,top)bottom=pdb.gimp_image_find_next_guide(image,top)bottom_y=pdb.gimp_image_get_guide_position(image,bottom)iftop_y>bottom_y:temp_y=top_ytop_y=bottom_ybottom_y=temp_yprint"Cutting from",top_y,"to",bottom_ypdb.gimp_rect_select(image,0,top_y,image.width,bottom_y-top_y,CHANNEL_OP_REPLACE,FALSE,0)pdb.gimp_edit_copy(image.active_drawable)image2=pdb.gimp_edit_paste_as_new()new_filename=image.filename[0:-4]+"_cut.jpg"pdb.file_jpeg_save(image2,image2.active_drawable,new_filename,"raw_filename",0.9,0.5,0,0,"New file",0,0,0,0)pdb.gimp_image_delete(image2)register("python-fu-special-crop","Crop an image","Crops the image.","Tomasz Muras","Tomasz Muras","2011","Special crop","*",[(PF_IMAGE,"image","Input image",None),],[],special_crop,menu="<Image>/Filters",)main()
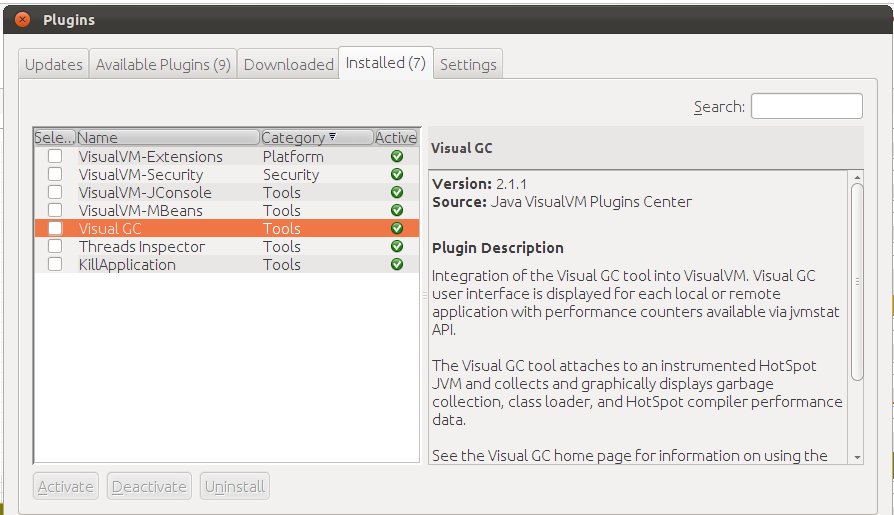
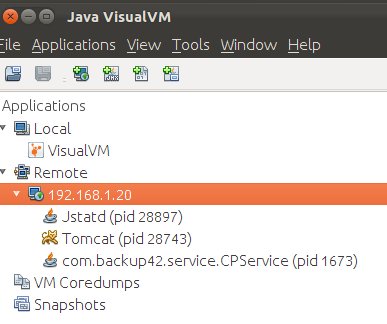
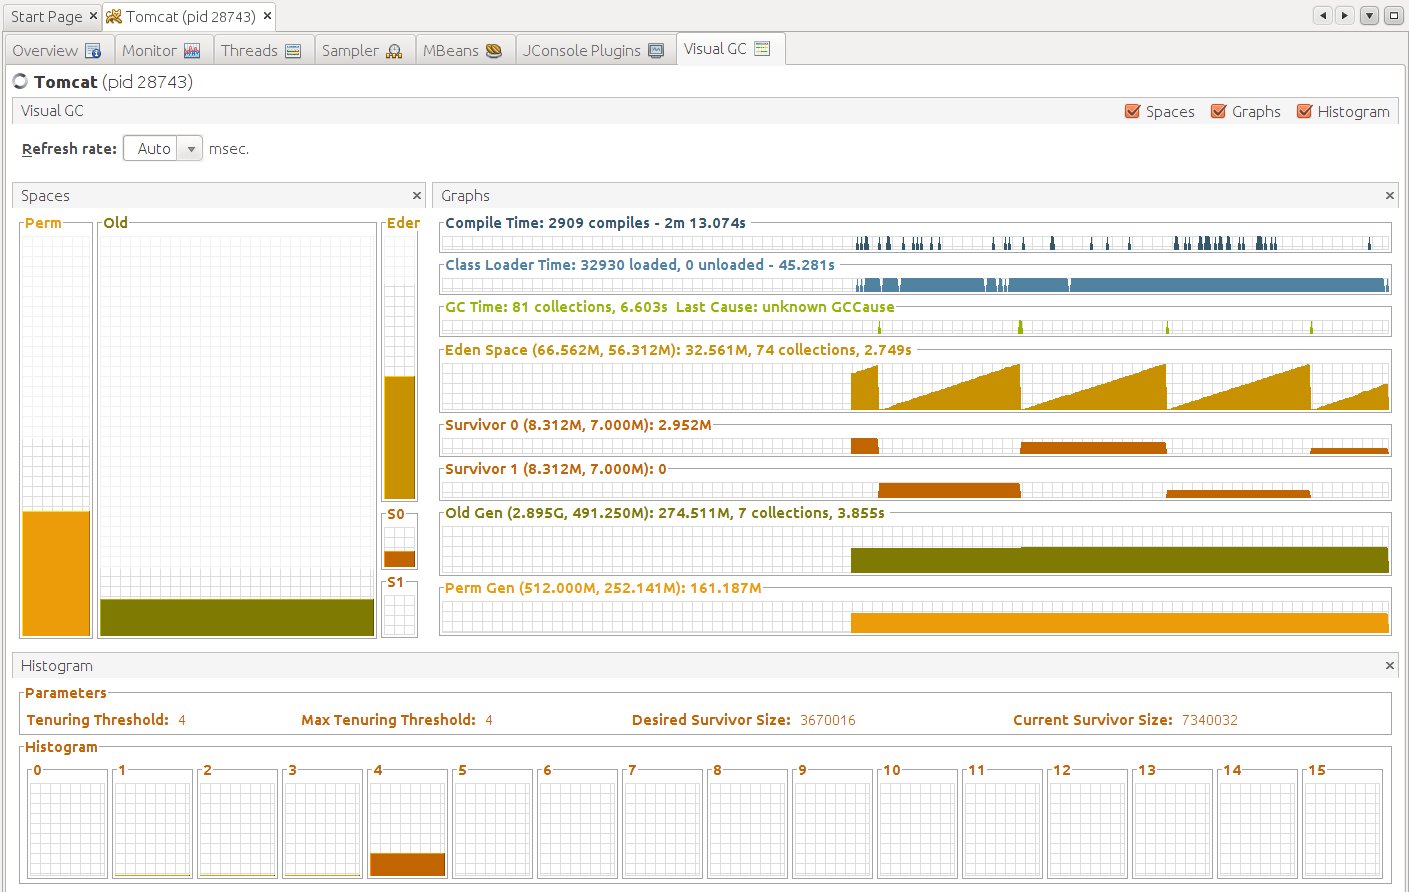
Sometimes it can be useful to monitor performance of Java Virtual Machine (VM) on remote host. To do so, a very nice tool – VisualVM – can be used. It can be run on local host and get information from jstatd running on a remote host. In addition, VisualVM comes with a number of useful plugins. This blog describes how to run VisualVM with VisualGC, which is Visual Garbage Collection Monitoring Tool to monitor Tomcat on remote machine. However, the solution can be also applied to other applications running on JavaVM.
Remote machine
Run Tomcat
Add the following options to CATALINA_OPTS variable to enable JMX support in Apache Tomcat.
To get JavaVM process status you can run jps command, which is Java Virtual Machine Process Status Tool. jps is located is your Java JDK HOME/bin directory. Description of jps command can be found here. Note that jps returns only Java processes run by the user, who runs jps. To get list of all Java processes run sudo jps. See examples below.
Notice that lvmid for Tomcat (in this case – Bootstrap) is ’28743′ which is the same as pid.
Hostname
Run
hostname
to check the host name, e.g., agile003.
Make sure that in /etc/hosts file this hostname has IP by which it is visible to the machine that will be running VisualVM (local machine), e.g., 192.168.1.20 agile003.
Run jstat Deamon
jstatd, which is jstat Daemon can be found in Java JDK HOME/bin. As described in documentation to jstatd, which can be found here: , create a file called jstatd.policy in any directory you choose, e.g., /home/joanna. The file should contain the following text:
grant codebase "file:${java.home}/../lib/tools.jar"{
permission java.security.AllPermission;};
Run jstatd using the following command. Make sure you run it with root permissions.
This guide will describe how to serve git repository on HTTP port using Apache. This should work on any recent Ubuntu or Debian release, I’ve tested it on Ubuntu Server 11.10. I’m setting it up on my local server 192.168.1.20 under git/agilesparkle, so my repository will be available at http://192.168.1.20/git/agilesparkle. I want it to be password protected but with only single user with following credentials: myusername/mypassword.
Server side
I assume you have Apache installed already. Switch to root account so we won’t need to add sudo all the time and install git:
$ sudo su
$ apt-get install git-core
Create directory for your git repository:
$ mkdir-p /var/www/git/agilesparkle
Create bare git repository inside and set the rights so Apache has write access:
% git clone http://192.168.1.20/git/agilesparkle
Cloning into agilesparkle...
Username:
Password:
warning: You appear to have cloned an empty repository.
Create sample file and push it into empty repository: