Using Pressure Stall Information (PSI) to find performance bottleneck
PSI stands for Pressure Stall Information and it’s an alternative to Linux load statistic that gives an insight into how and why your system is busy.
We will use it to identify where is a performance bottleneck in my web application - Moodle. My environment is a single server running Ubuntu 20.04 with PHP, Apache, MySQL and Redis.
I have run a jmeter test that emulates login and forum post by a number of users. While running the tests, I’m capturing load and pressure information:
while true; do echo $(cat /proc/loadavg | cut -d ' ' -f1),$(cat /proc/pressure/cpu | cut -d' ' -f2 | cut -d= -f2),$(grep some /proc/pressure/io | cut -d' ' -f2 | cut -d= -f2),$(grep some /proc/pressure/io | cut -d' ' -f2 | cut -d= -f2) >> monitor.csv; sleep 10; doneThe results of the first run are:
Starting standalone test @ Sat Oct 17 17:22:54 CEST 2020 (1602948174177)
...
summary =    560 in 00:04:10 =    2.2/s Avg: 10655 Min:    74 Max: 32890 Err:     0 (0.00%)
Tidying up ...    @ Sat Oct 17 17:27:04 CEST 2020 (1602948424452)
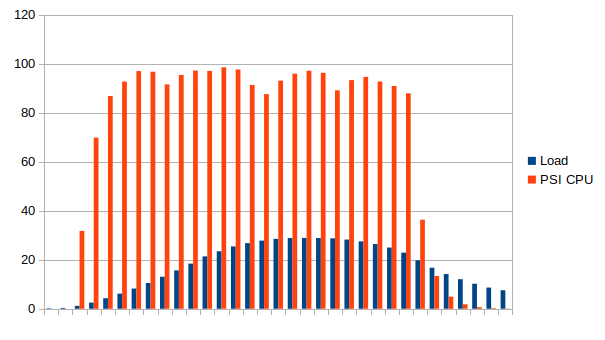
The load jumps up to 30 and CPU pressure reaches 99%. It means that at some point, 99% of the processing was not happening, because the processes waited for CPU to be available. It’s clearly a bottleneck on the CPU side. The low pressure numbers on the I/O side confirm that (I’m not even showing them on the graph as they are close to 0).
Now - let’s put the data on a slow filesystem. I’m using nbd + trickle for emulating slow storage.
apt-get install nbd-client nbd-server trickle
modprobe nbd
trickle -d 100 -u 100 -v nbd-server -d
nbd-client -N test  127.0.0.1 /dev/nbd0
mount -o sync /dev/nbd0 /mnt/nbd
The result is the same:
Starting standalone test @ Sat Oct 17 18:15:21 CEST 2020 (1602951321747)
...
summary =    560 in 00:04:10 =    2.2/s Avg: 10281 Min:    73 Max: 31974 Err:     0 (0.00%)
Tidying up ...    @ Sat Oct 17 18:19:32 CEST 2020 (1602951572190)
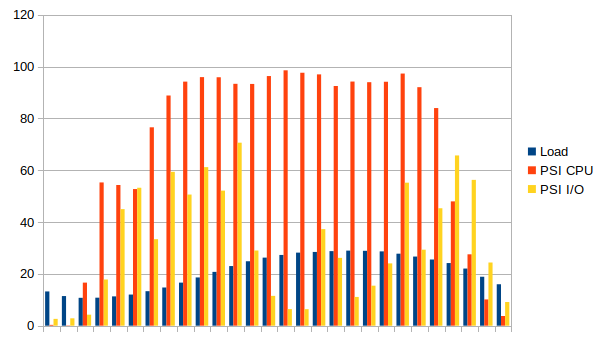
But this time we see higher utilization of the I/O - pressure number reaches 70%.

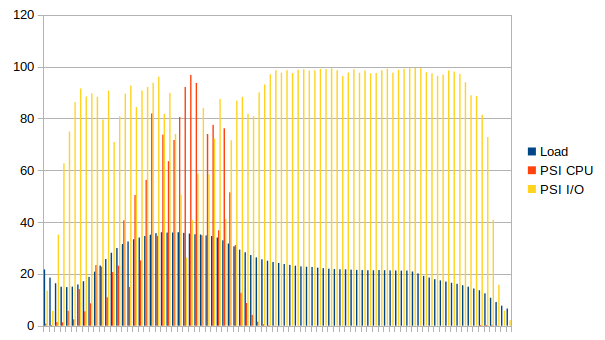
Let’s push it further and slow down the storage even more. This time we see a significant drop in the performance (from 2.2 to 0.7 requests per second) .
Starting standalone test @ Sat Oct 17 18:30:16 CEST 2020 (1602952216410)
...
summary =    560 in 00:13:13 =    0.7/s Avg: 33207 Min:    68 Max: 380378 Err:     0 (0.00%)
Tidying up ...    @ Sat Oct 17 18:43:30 CEST 2020 (1602953010187)
The CPU pressure is lower and full pressure I/O reaches 99%. This time the bottleneck is clearly on the I/O side.
Note that the information of CPU vs I/O is clearly visible when using PSI. The standard “load” information is not enough to distinguish between those two.
You can see PSI information with tools like “atop”.
