Sometimes it might be very convenient to be able to debug application deployed on web server. This tutorial presents how to do it, if the application is deployed using Jetty plugin for Maven or Tomcat servers.
Jetty Maven plugin
Set the following MAVEN_OPTS to the following:
export MAVEN_OPTS='-Xdebug -Xrunjdwp:transport=dt_socket,address=4000,server=y,suspend=y'Run Jetty Maven plugin:
mvn jetty:runSample setting of the development environment can be found here: Eclipse environment for convenient development of Java web application using Maven, Spring, Struts2, and Hibernate running on Jetty server.
Tomcat
Use default options of Tomcat which are
-agentlib:jdwp=transport=dt_socket,address=8000,server=y,suspend=nor set JPDA_OPTS using the following command:
export JPDA_OPTS='-agentlib:jdwp=transport=dt_socket,address=4000,server=y,suspend=y'Run Tomcat:
catalina jpda startArguments
Here is list of parameters for the debugging.
- Xdebug – Start the JVM and listen for debugging connections.
- Xrunjdwp – The remote debugging connection parameters.
- transport=dt_socked – Use sockets.
- address=4000 – The port to connect to or the shared memory address to use.
- server=y – Start in server mode.
- suspend=y – If ‘n’ don’t wait for a debugger to be attached. If ‘y’ your application will lunch only when you run your debugger.
Debugging in Eclipse
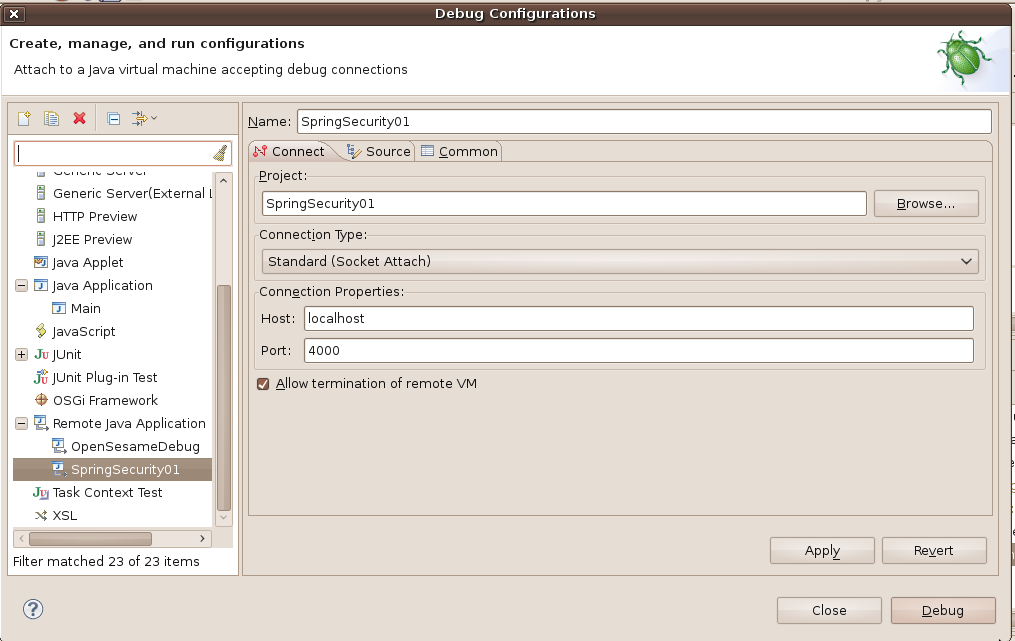
Go to: Debug -> Debug Options…
Select: Remote Java Application
Select project
Use the same port as defined in ‘address’

Click: Debug
If ‘suspend=y’ then your application should start. At this stage when you put any break point in Eclipse, your application should stop there.
References
Please refer to: